How Black cartographers put racism on the map of America
Published in Political News


How can maps fight racism and inequality?
The work of the Black Panther Party, a 1960s- and 1970s-era Black political group featured in a new movie and a documentary, helps illustrate how cartography – the practice of making and using maps – can illuminate injustice.
As these films show, the Black Panthers focused on African American empowerment and community survival, running a diverse array of programming that ranged from free school breakfasts to armed self-defense.
Cartography is a less documented aspect of the Panthers’ activism, but the group used maps to reimagine the cities where African Americans lived and struggled.
In 1971 the Panthers collected 15,000 signatures on a petition to create new police districts in Berkeley, California – districts that would be governed by local citizen commissions and require officers to live in the neighborhoods they served. The proposal made it onto the ballot but was defeated.
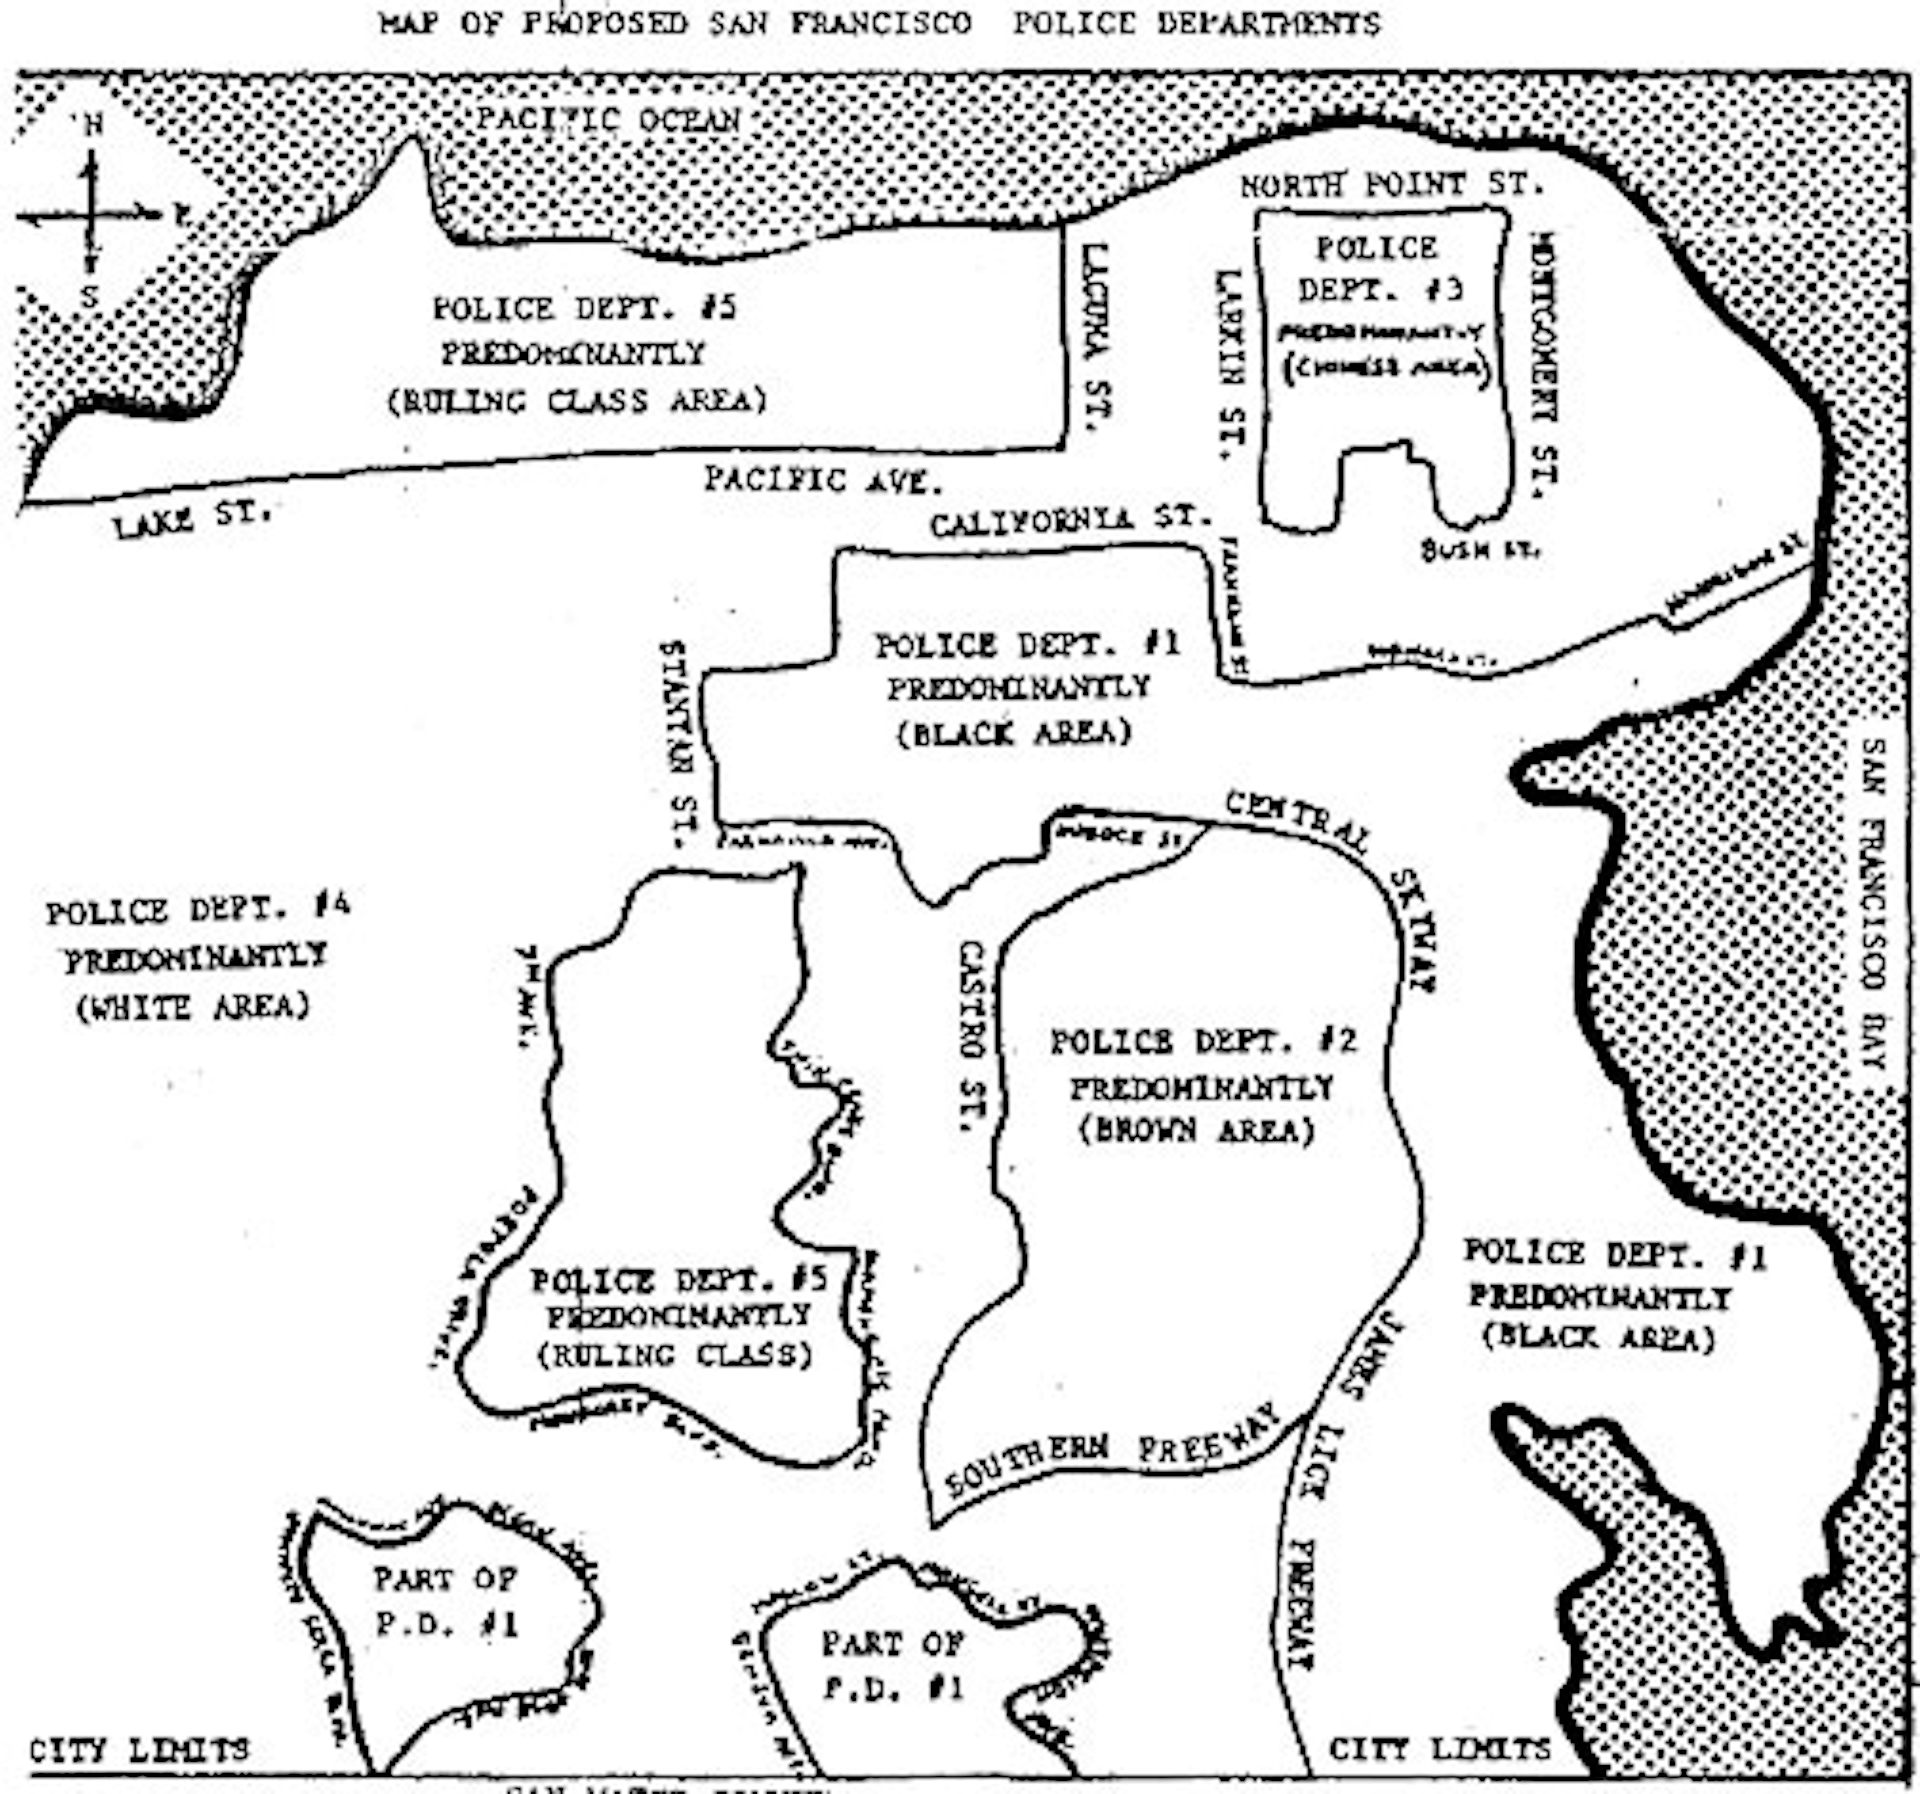
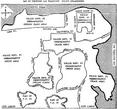
In a similar effort to make law enforcement more responsive to communities of color, the Panthers in the late 1960s also created a map proposing to divide up police districts within San Francisco, largely along racial lines.
The Black Panthers are just one chapter in a long history of “counter-mapping” by African Americans, which our research in geography explores. Counter-mapping refers to how groups normally excluded from political decision-making deploy maps and other geographic data to communicate complex information about inequality in an easy-to-understand visual format.
Maps are not ideologically neutral location guides. Mapmakers choose what to include and exclude, and how to display information to users.
These decisions can have far-reaching consequences. When the Home Owners Loan Corporation in the 1930s set out to map the risk associated for banks loaning money to individuals for homes in different neighborhoods, for example, they rated minority neighborhoods as high risk and color-coded them as red.
The result, known as “redlining,” contributed to housing discrimination for three decades, until federal law banned such maps in 1968. Redlining’s legacy is still evident in many American cities’ patterns of segregation.
Colonial explorers charting their journeys and city planners and developers pursuing urban renewal, too, have used cartography to represent the world in ways that further their own priorities. Often, the resulting maps exclude, misrepresent or harm minority groups. Academics and government officials do this, too.
Counter-maps produce an alternative public understanding of the facts by highlighting the experiences of oppressed people.
Black people aren’t the only marginalized group to do this. Indigenous communities, women, refugees and LGBTQ communities have also redrawn maps to account for their existence and rights.
But Black Americans were among the earliest purveyors of counter-mapping, deploying this alternative cartography to serve a variety of needs a century ago.
Mapping is part of the broader Black creative tradition and political struggle.
Over the centuries, African Americans developed “way-finding” aids, including a Jim Crow-era travel guide, to help them navigate a racially hostile landscape and created visual works that affirmed the value of Black life.
The Black sociologist and civil rights leader W.E.B. Du Bois produced maps for the 1900 Paris Exposition to inform international society about the gains African Americans had made in income, education and land ownership since slavery and in face of continuing racism.
Similarly, in 1946, Friendship Press cartographer and illustrator Louise Jefferson published a pictorial map celebrating the contributions of African Americans – from famous writers and athletes to unnamed Black workers – in building the United States.
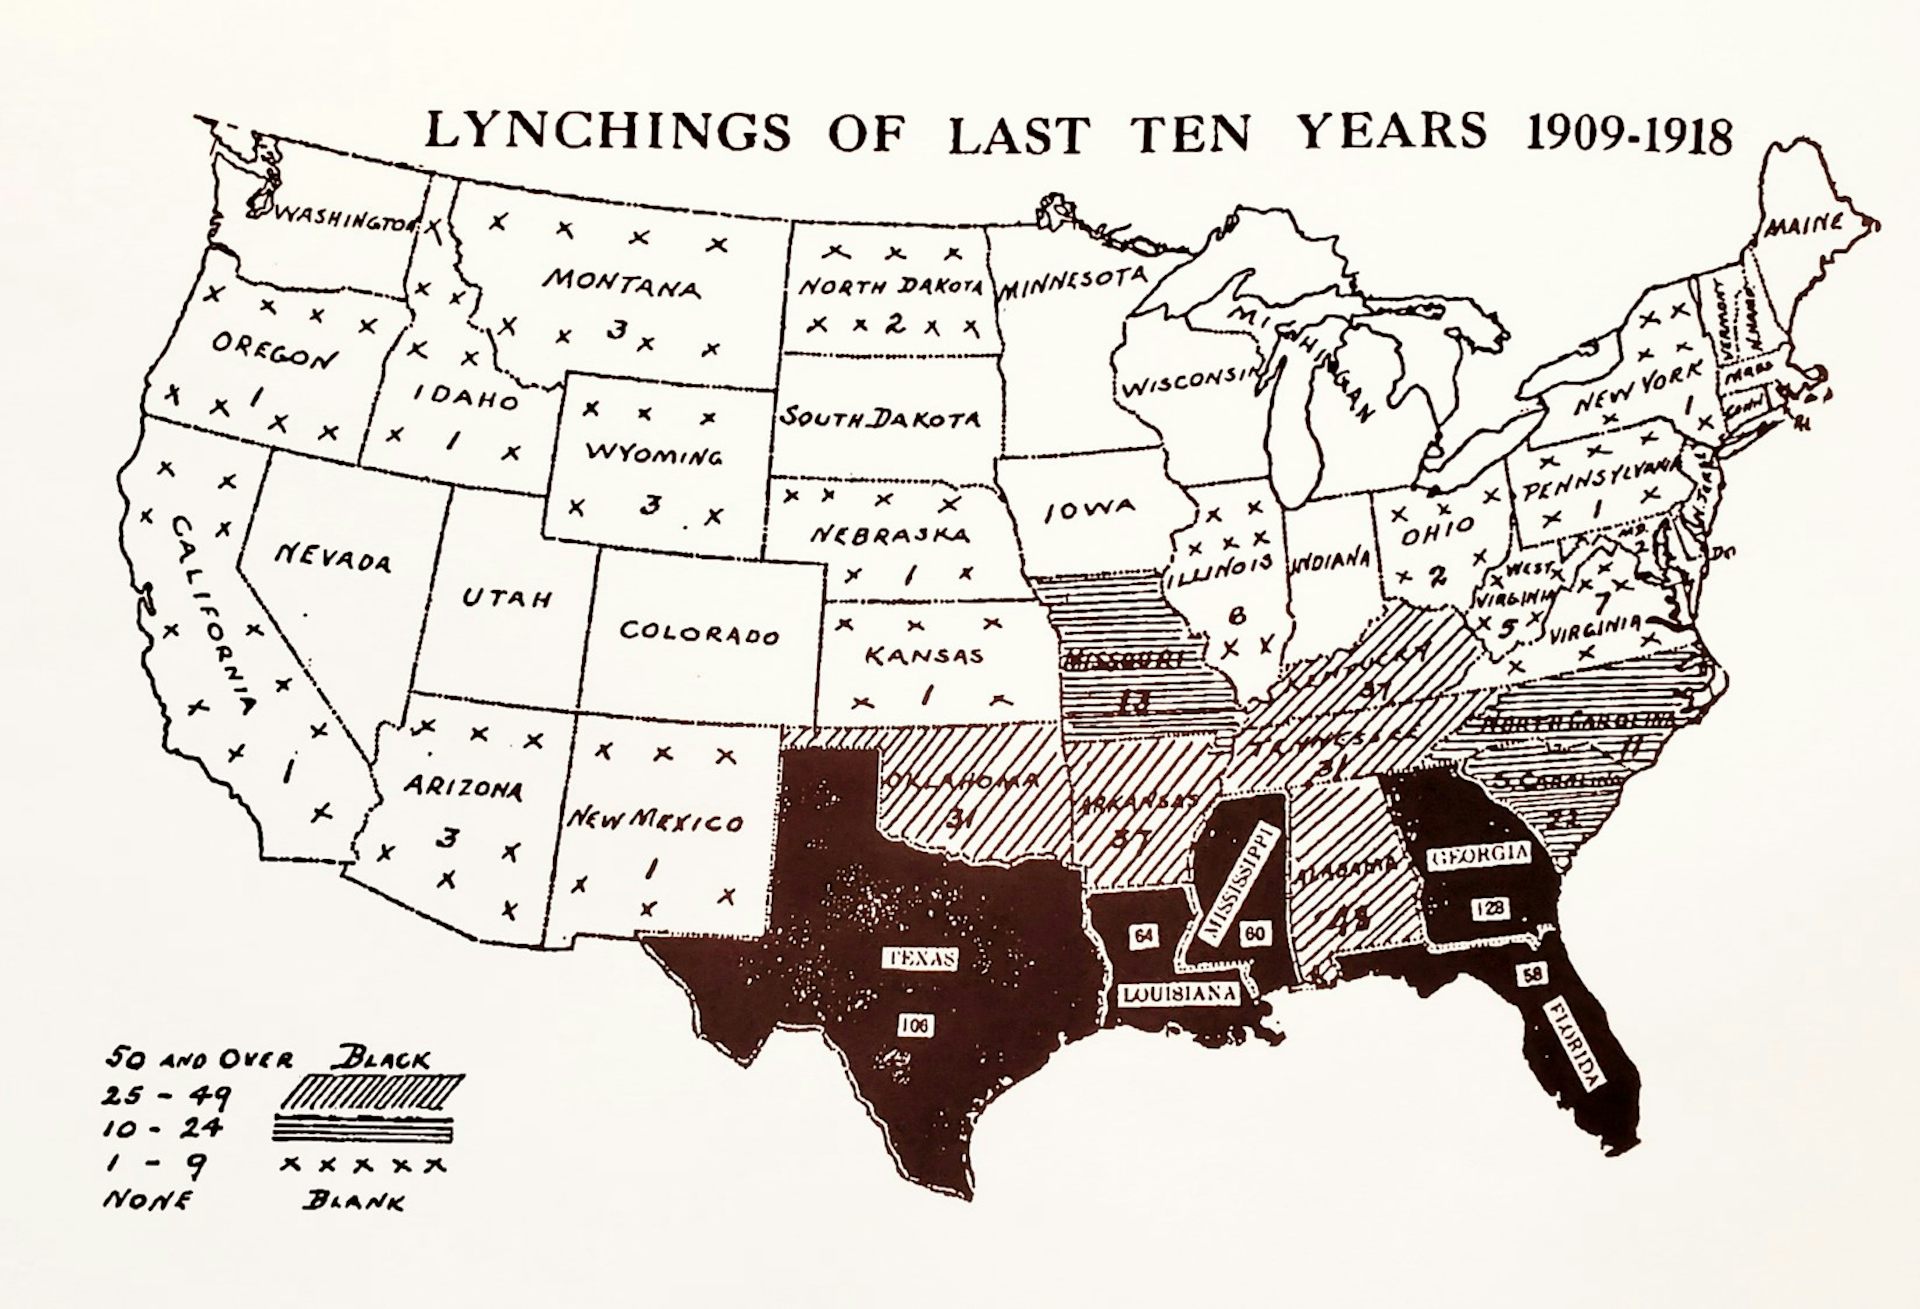
In the early 20th century, anti-lynching crusaders at the NAACP and Tuskegee Institute stirred public outcry by producing statistical reports that informed original hand-drawn maps showing the location and frequency of African Americans murdered by white lynch mobs.
One map, published in 1922 in the NAACP’s magazine “Crisis,” placed dots on a standard map to document 3,456 lynchings over 32 years. The Southeast had the largest concentration. But the “blots of shame,” as mapmaker Madeline Allison called them, spanned the country from east to west and well into the north.
These visualizations, along with the underlying data, were sent to allied organizations like the citizen-led Commission on Interracial Cooperation, to newspapers nationwide and to elected officials of all parties and regions. The activists hoped to spur Congress to pass federal anti-lynching legislation – something that remains to this day unfinished business.
Much anti-lynching cartography was inspired by the famed activist and reporter Ida B. Wells, who in the early 1880s made some of the first tabulations of the prevalence and geographic distribution of racial terror. Her work refuted prevailing white claims that lynched Black men had sexually assaulted white women.
The precariousness of Black life – and the exclusion of Black stories from American history – remains an unresolved issue today.
Working alone and with white allies, Black activists and scholars continue using cartography to tell a fuller story about the United States, to challenge racial segregation and to combat violence.
Today, the maps they create are often digital.
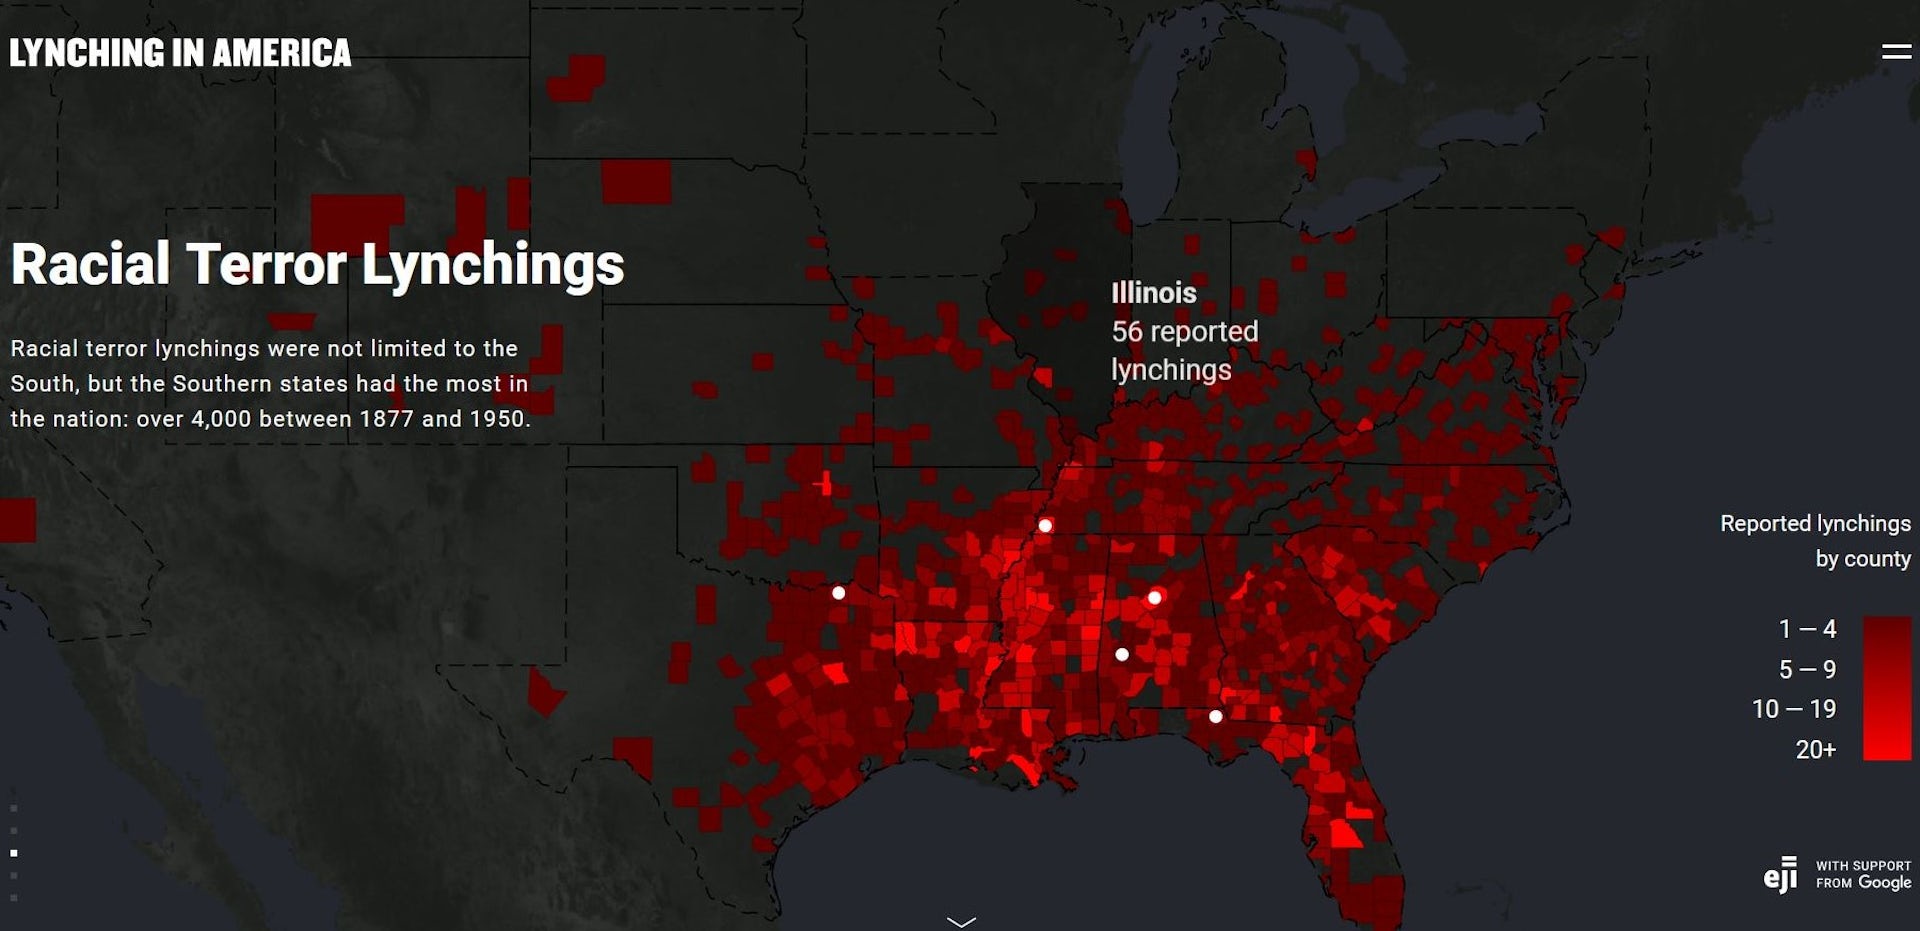
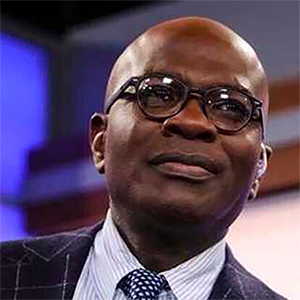
For example, the Equal Justice Initiative, the Alabama-based legal defense group run by Bryan Stevenson, has produced a modern map of historical lynching. It’s an interactive update of the anti-lynching cartography made 100 years ago – although a full reconstruction of lynching terror remains impossible because of incomplete data and the veil of silence that persists around these murders.
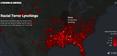
Another modern mapping project, called Mapping Police Violence, was launched by data activists after Michael Brown’s murder in Ferguson, Missouri, in 2014. It tracks police use of force using a time-series animated map. Deaths and injuries flash across the screen and accumulate on the map of the United States, visually communicating the national scale and urgency of this problem.
Counter-mapping operates on the theory that communities and governments cannot fix problems that they do not understand. When Black counter-mapping exposes the how-and-where of racism, in accessible visual form, that information gains new power to spur social change.
This article is republished from The Conversation, a nonprofit, independent news organization bringing you facts and trustworthy analysis to help you make sense of our complex world. It was written by: Derek H. Alderman, University of Tennessee and Joshua F.J. Inwood, Penn State
Read more:
What I learned when I recreated the famous ‘doll test’ that looked at how Black kids see race
Will European countries ever take meaningful steps to end colonial legacies?
Women of color spend more than billion on bleaching creams worldwide every year
Derek H. Alderman receives funding from National Science Foundation and National Endowment for the Humanities.
Joshua F.J. Inwood receives funding from the National Science Foundation.


Comments